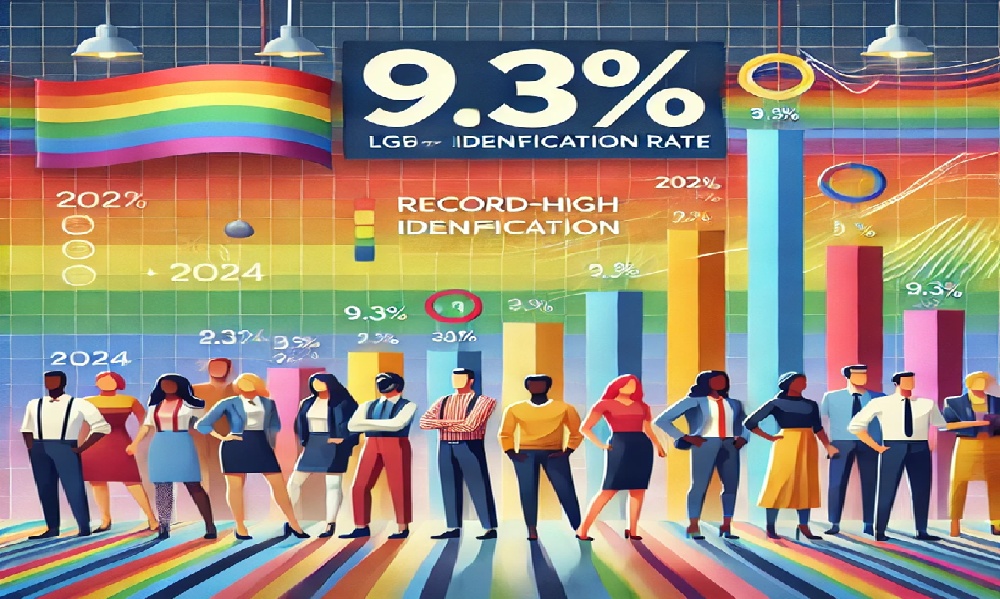
WASHINGTON: A recent Gallup poll shows 9.3% of US adults now identify as LGBTQ+. This is a 1% increase from 2023 and nearly triple since 2012.
LGBTQ+ identification has doubled since 2020, reflecting generational changes.
Younger adults are far more likely to identify as LGBTQ+ than older generations.
More than 20% of Gen Z adults say they are part of the LGBTQ+ community.
Generational Trends
From 2020-2022, 18.8% of Gen Z adults identified as LGBTQ+.
Over the past two years, this increased to 22.7%.
Millennials saw a nearly two-point increase, from 10.3% to 12%.
Generation X identification rose from 3.8% to 4.8%.
Baby boomers and the Silent Generation saw no significant change.
Survey Findings
The results come from 14,000 interviews conducted by Gallup in 2024.
Respondents chose from heterosexual, lesbian, gay, bisexual, transgender, or other identities.
Among LGBTQ+ respondents, 56% identified as bisexual.
21% identified as gay, 15% as lesbian, and 14% as transgender.
Some respondents identified with multiple LGBTQ+ categories.
Bisexual Majority
Younger LGBTQ+ adults are more likely to identify as bisexual.
Among LGBTQ+ Gen Z, 59% say they are bisexual.
For millennials, bisexual identification is 52%.
That drops to 44% in Generation X and 19% among baby boomers.
The Silent Generation has the lowest bisexual identification at 11%.
Demographic Differences
LGBTQ+ identification varies by gender, political affiliation, and location.
Women (10%) are more likely than men (6%) to identify as LGBTQ+.
Democrats (14%) and independents (11%) have higher rates than Republicans (3%).
21% of liberals identify as LGBTQ+, compared to 8% of moderates and 3% of conservatives.
LGBTQ+ identification is higher in urban areas (11%) than in rural regions (7%).
Young Women Lead
The gender gap is most pronounced among younger generations.
31% of Gen Z women identify as LGBTQ+, compared to 12% of Gen Z men.
Among millennials, 18% of women and 9% of men identify as LGBTQ+.
Most of these younger women identify as bisexual.
Nonbinary individuals overwhelmingly identify as LGBTQ+.
Other Trends
College graduates (9%) and non-graduates (10%) show similar LGBTQ+ identification rates.
Income, marital status, race, and religion affect LGBTQ+ identification trends.
Lower-income, non-married, and non-religious individuals have higher LGBTQ+ identification rates.
Non-White Americans also show higher LGBTQ+ identification rates.
These trends are largely influenced by age demographics.
Future Outlook
LGBTQ+ identification has tripled since 2012 and is expected to keep rising.
Young adults are driving this increase, especially bisexual women.
Future generations will likely identify as higher rates.
As more open-minded views spread, identification trends may continue evolving.
LGBTQ+ visibility and acceptance remain key factors shaping societal shifts.